Making competent investment decisions can be extremely complicated, especially when the risk of failure is high. Our company has been involved with the application of quantitative and qualitative decision-making tools and techniques for over 20 years. Many of those decisions involved capital intensive industries, such as oil and gas exploration and production, chemicals, and retail operations. Decision quality, as described by some of the preeminent thought leaders in the field such as Dr. Ron Howard of Stanford University and Dr. Carl Spetzler of Strategic Decision Group provide insight into key qualities of good decisions.
- Should I purchase a competitor or should I continue to incrementally grow through improved operating and marketing performance?
- Should I expand my business through capital investment or continue operating under the current physical constraints?
- Should I exit a weak or low-margin market or should I spend more marketing dollars to increase the market’s penetration and margin performance?
- Should I purchase a new office building or should I continue to lease?
Common misconceptions about what constitutes good decision making:
- “A good decision is one that produces a desired outcome.”
- “A good decision is one that has the highest chance of getting the best outcome.”
- A good decision is one that has the lowest chance of getting the worst outcome”
There are six key elements of good decision quality: *
- Every decision requires a decision maker or person who will act and has the authority and power to allocate resources. A decision maker must not only contemplate action but must be empowered to act.
- A way of viewing the decision framework is called the frame and provides an answer to the question, “what am I deciding?”
- An appropriate frame will lead to developing a set of substantially different decision alternatives that are appropriate for addressing that specific frame and are available to the decision maker.
- A decision maker will obviously have values based on preferences and will weigh each of the alternatives based on clear, carefully specified preferences and values.
- The link between what we can do and what we eventually want to do is provided by the information gathered and analyzed. To be effective, information gathering should neither be overdone or underdone.
- Once we have gathered the information, we can use the best set of tools, both qualitative and quantitative to employ logical reasoning to our decision.
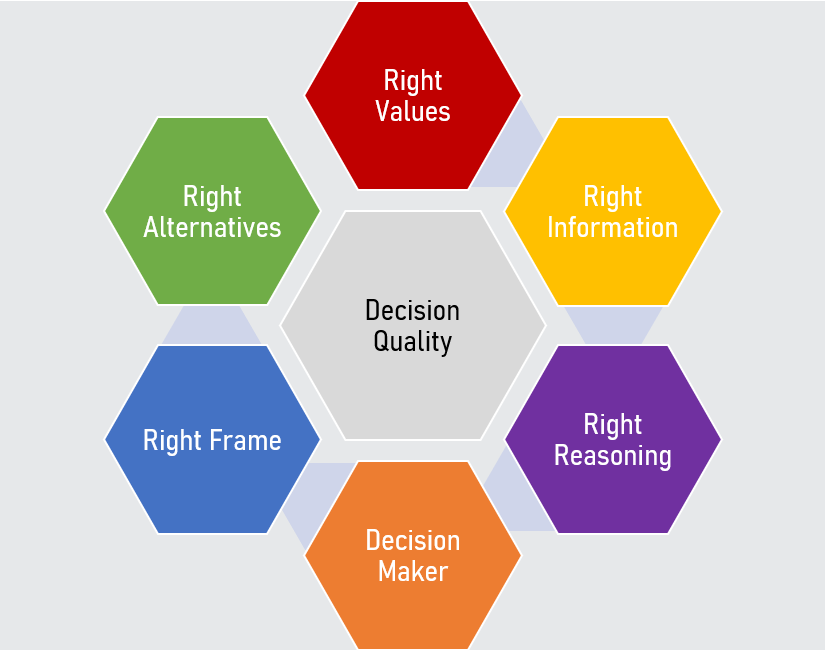
*Source: Ronald A. Howard, “Foundations of Decision Analysis”, 2016
In many instances, if the problem involves complex or multiple decisions and uncertainties, we will use decision trees to illustrate the decision process and calculate an objective expected outcome to assist in navigating through the decision.
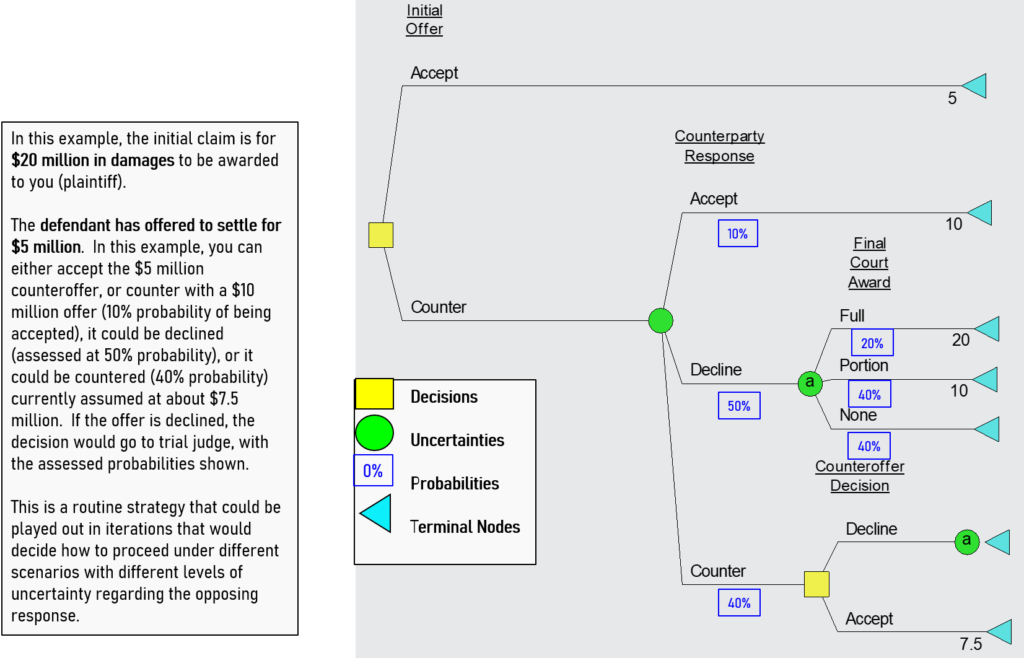
Here is an example of a decision tree using software called Decision Programming Language (DPL) by Syncopation Software, Inc. This example illustrates a negotiating strategy for settling a legal dispute:
The yellow squares are decisions, the green circles are uncertainties and the cyan triangles are end nodes. We create and read this decision tree chronologically from left to right with the values (amount of money awarded) calculated at the end or terminal nodes.
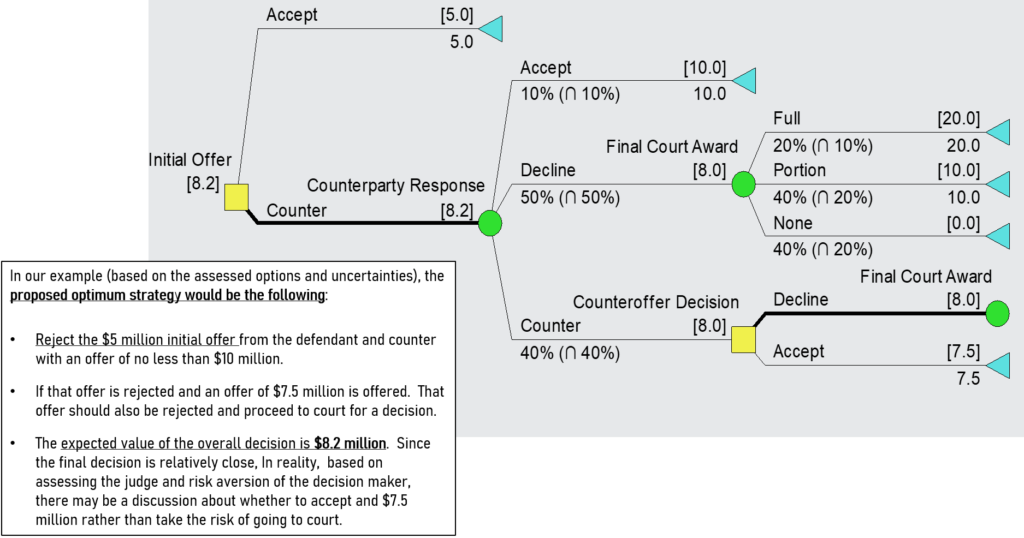
- Decisions, represented by yellow squares, are factors that can be controlled by the decision maker and in this example, the highest value branch is selected (“Counter” = $8.2 million versus “Accept” = $5.0 million). Examples of decisions include the offering price for products, markets to enter, acquisition price for target, etc.
- Uncertainties, represented by green circles, are variables that cannot be controlled by the decision maker. Examples include decision that can be made by competitors, market demand, future expenses, etc.
- Probabilities, represented by blue squares, reflect the chance or assessed probability that a particular uncertainty will occur.
- Terminal nodes, represented by cyan triangles, are calculated values at each branch of the decision tree. These values determine the optimal path when the values are rolled back (from right to left).
After the framework of the decision is developed, we can then quantify the alternatives to make an objective decision by rolling back the tree from right to left and determine the optimum path for the decision with the highest expected value: “Accept” the initial offer ($5.0 million) vs. “Counter” the initial offer ($8.2 million). Generally, the highest value alternative is accepted, but exceptions can apply when the risk is high or the values between the choices are close.
Decision trees are commonly used tools to simplify complex sequential options being faced by a business or operation.
We have other tools and techniques that can assist organizations, both large and small, navigate through very complex and messy decisions into actionable plans that can be effectively executed.
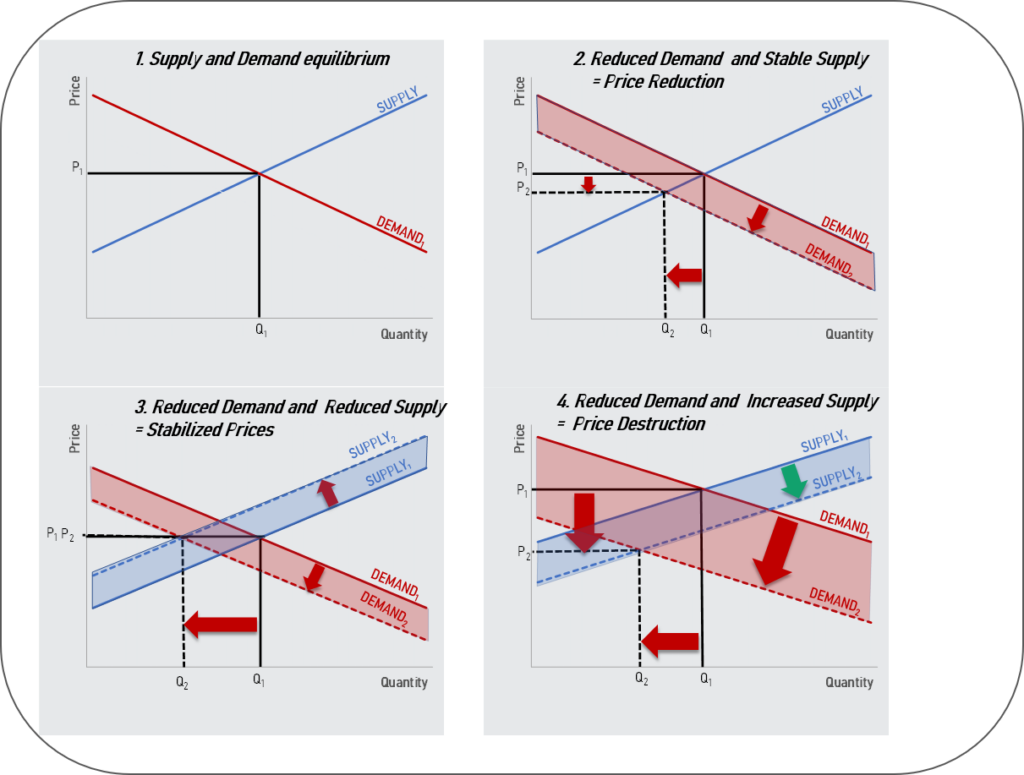
For example, what is the impact of competition or supply on the market. Supply and demand analysis provides an understanding of how various market forces impact sales and price forecasts – using basic macroeconomics principles.